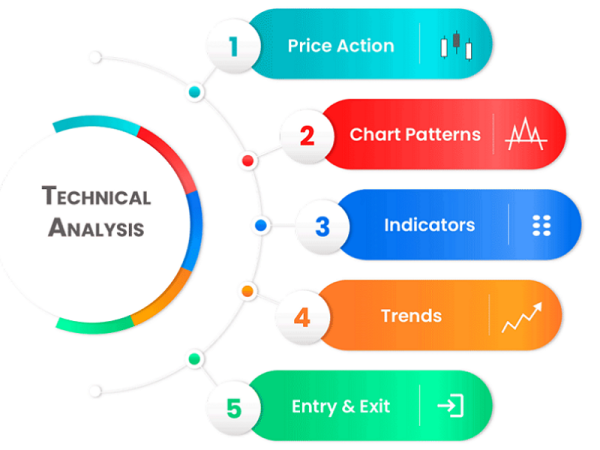
Technical Market Analysis is an elementary technique traders use to investigate financial markets and predict future price movements utilizing prior data. Unlike fundamental analysis, which focuses on the financial state of a business or economic indicators, technical analysis relies on charts and price correlations to forecast trends.
Its applicability spans multiple markets, including stocks, FX, commodities, and cryptocurrencies, providing traders insight into market feelings and predicted fluctuations in prices. Learn the Full guide about The Value of Technical Inspection in Capital Market Trading in Pakistan from our online trusted Institute Lutfi Institute of Capital Market.
Key Concepts for Technical Analysis
Technical analysis depends on three fundamental pillars:
1. Price Discounts Everything: Technical analysts believe that an asset’s price already incorporates every available information, such as economic data and business news. As a result, they rely primarily on price movements to make forecasts.
2. Price Movements in Trends: Market prices tend to exhibit identifiable patterns over time. Trends, whether bullish (upward), bearish (downward), or sideways, are a vital component of technical analysis, and traders attempt to time their trades by these movements.
- History Repeats Itself: Technical analysis assumes that market actions are typically expected because of trader psychology. Similar patterns appear if traders react to market scenarios in predictable ways, which reiterates price trends and movements.
Tools and Techniques for Technical Analysis
Technical analysts make use of many different kinds of approaches to evaluate price data and generate trading signals. Some of the most common are as follows:
1. Charts: Price charts, such as candlestick, bar, and line charts, illustrate an asset’s price over time. Traders analyze these charts to find trends, price patterns, and market sentiment.
- Support and Resistance: Support indicates a price level where an asset typically stops declining, while resistance is a level where it combats to rise. Identifying these levels will help traders in forecasting potential price reversals.
3. Moving Averages: Moving averages smooth out price data to identify trends. Common types include the Simple Moving Average (SMA) and Exponential Moving Average (EMA), which help traders determine the market’s overall direction.
4. Relative Strength Index (RSI): RSI measures the strength of a price movement. It is used to identify overbought or oversold conditions, signaling potential reversals.
5. MACD (Moving Average Convergence Divergence): MACD helps traders spot changes in momentum and potential trend reversals by analyzing the relationship between two moving averages.
The importance of technical analysis.
1. Trend Identification: Technical analysis permits traders to spot market trends early on, allowing them to make money from upward or downward price movements. Understanding trends can be crucial for modifying trading strategies to market direction.
2. Timing trades: Traders can effectively time their trades by analyzing patterns in charts and indicators. They may determine entry and exit points based on support, resistance, and technical indicators.
3. Risk Management: Technical analysis enables you to manage risk by identifying expected stop-loss and take-profit levels. Traders may apply limits to lower losses and lock in profits, rendering them an essential component of any trading strategy.
Conclusion
Technical analysis is an important instrument for capital market traders. It provides essential knowledge of market structures, timing, and risk management, enabling traders to make better choices. While it has limitations, when combined with sturdy trading discipline, technical analysis is an effective instrument for navigating the complex world of financial markets.

